

Part 1: The Personal Enrichment Strategy - How Trump Built a Billion-Dollar Empire
Trump's Unprecedented Wealth Explosion
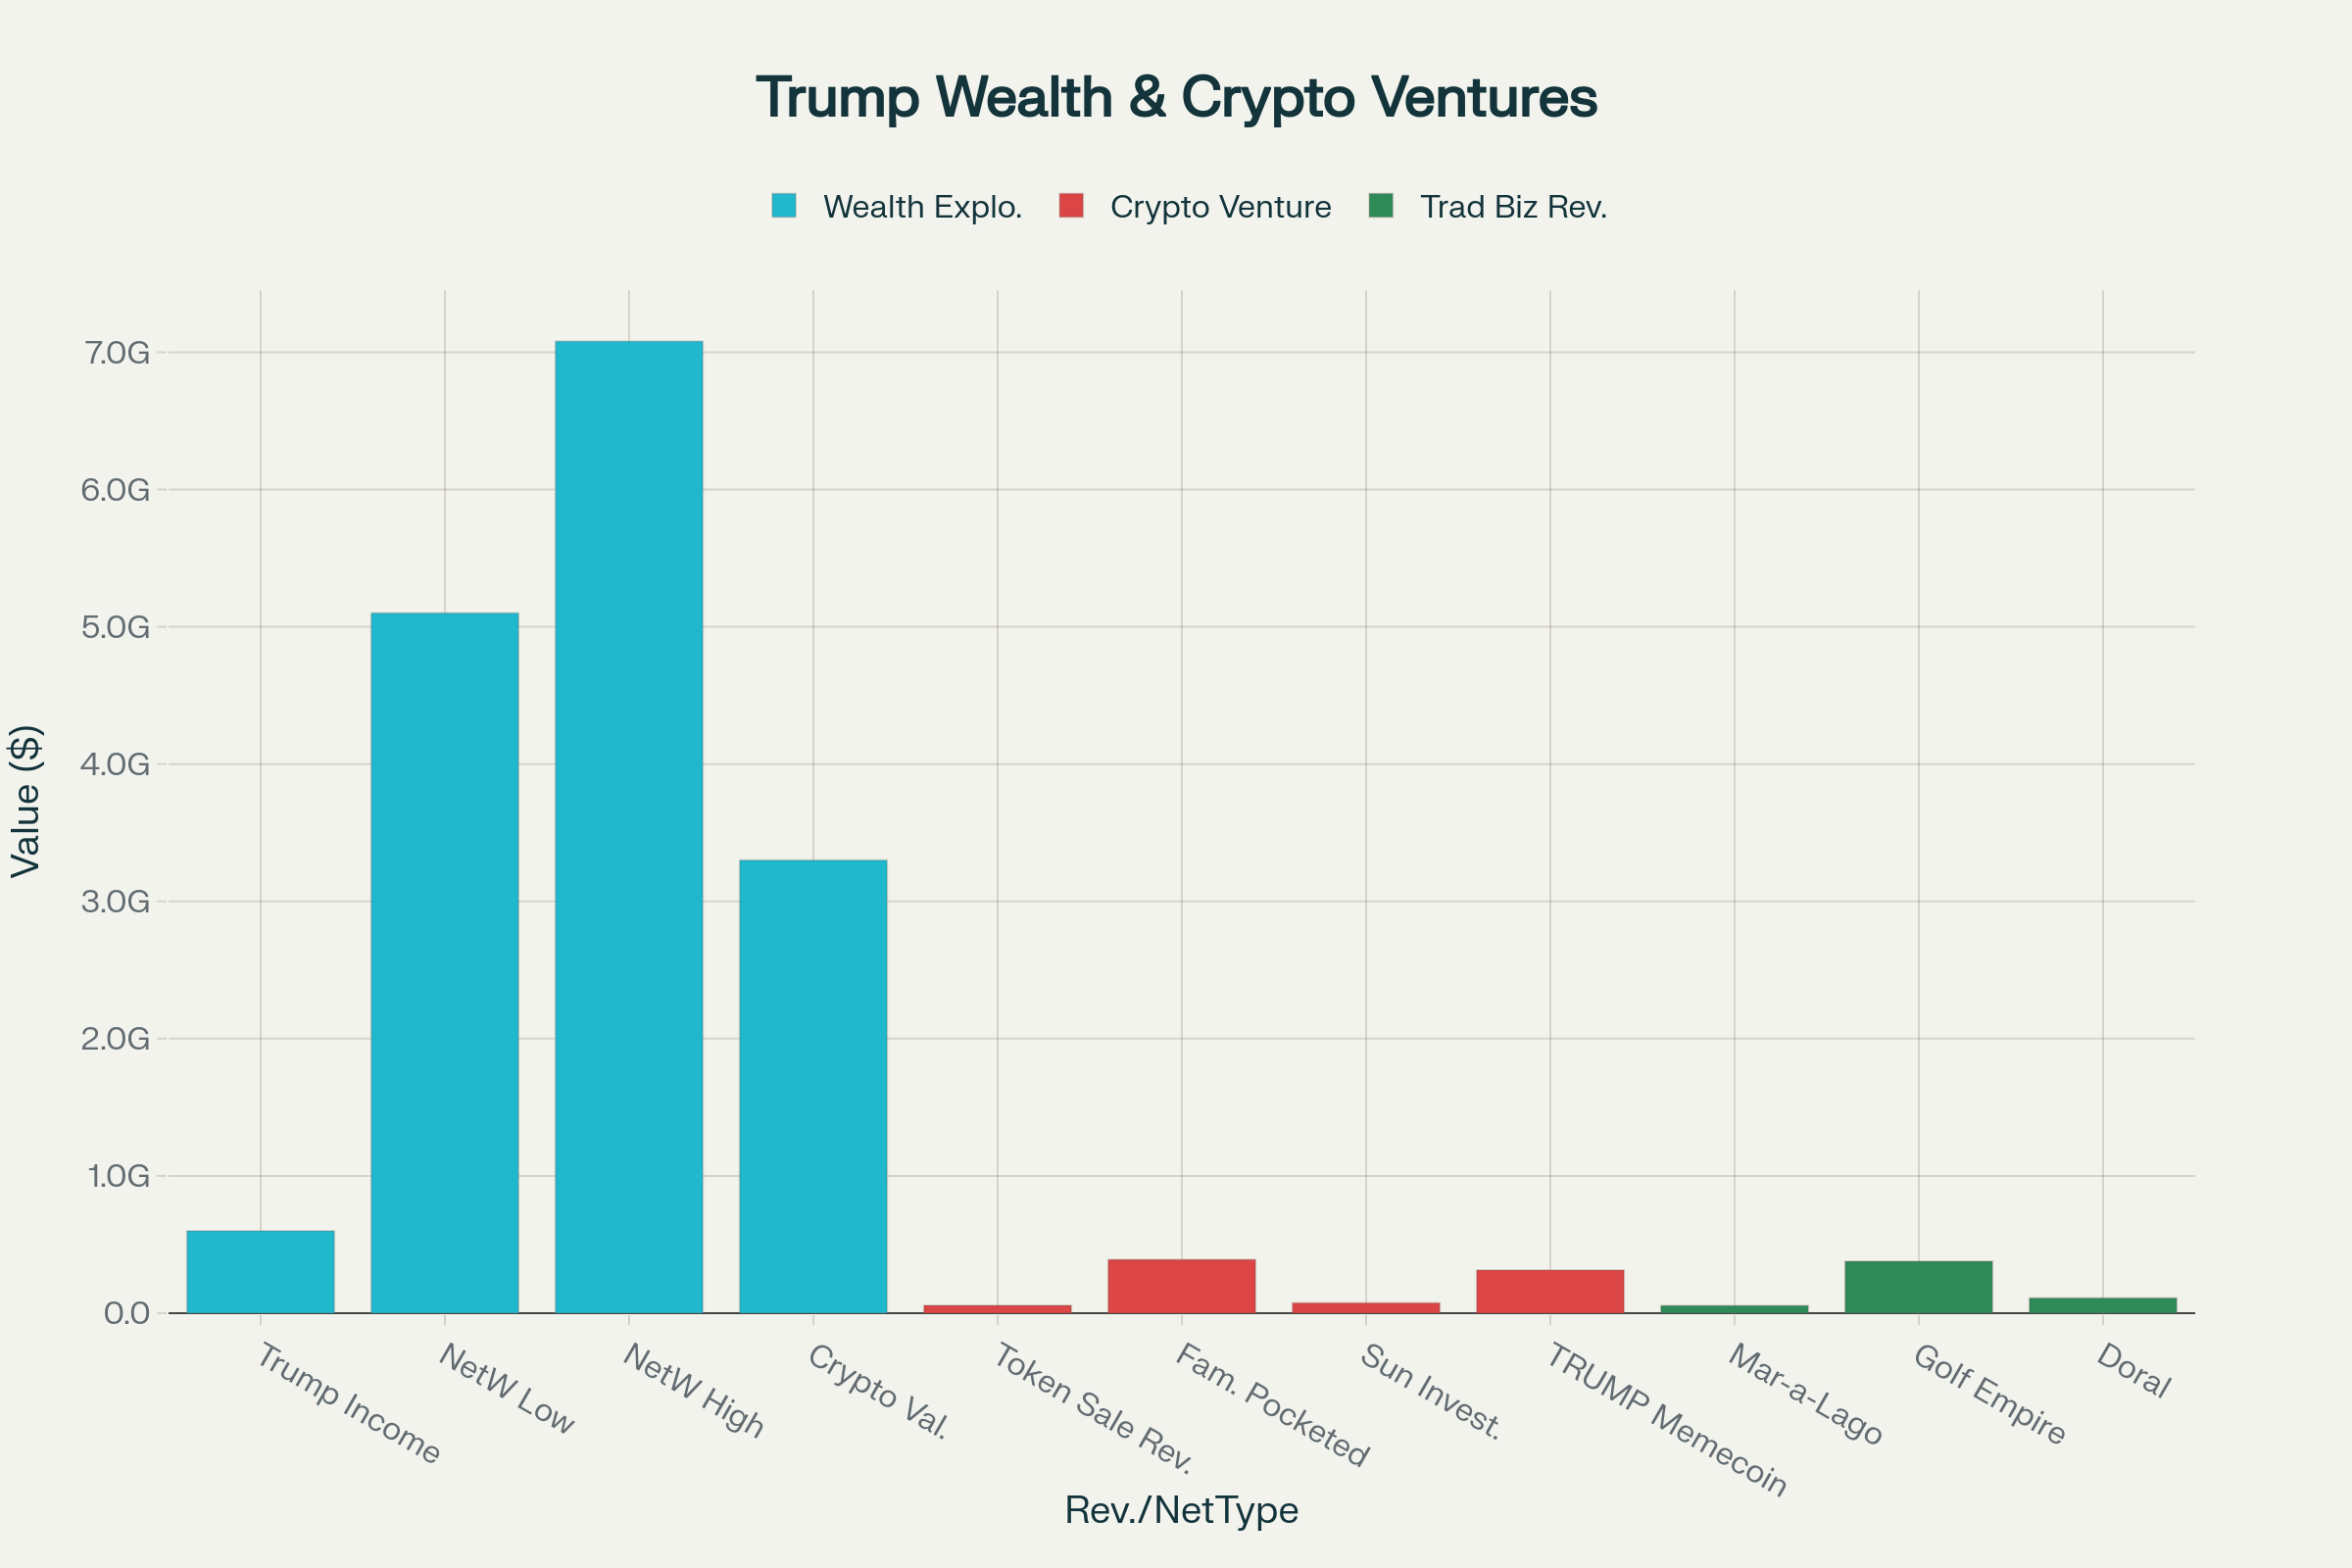
Donald Trump's return to the presidency in 2025 marked an unprecedented period of personal wealth accumulation for a sitting president. According to official financial disclosures filed with the Office of Government Ethics, Trump reported over $600 million in income for 2024 alone, with his net worth soaring from an estimated $2.3 billion to between $5.1 billion and $7.08 billion by mid-2025.
The most striking aspect of Trump's wealth explosion lies in his strategic pivot to cryptocurrency ventures, which now represent approximately 60% of his total net worth—an estimated $3.3 billion. This dramatic shift began just before his second campaign and accelerated rapidly once he returned to office, raising unprecedented questions about conflicts of interest.
The Cryptocurrency Empire: A New Revenue Stream
Trump's cryptocurrency ventures represent perhaps the most audacious example of a president monetizing his office in modern American history. The cornerstone of this empire is World Liberty Financial, a decentralized finance platform that Trump and his family launched in 2024. According to SEC filings, the venture has generated $57.7 million directly for Trump from token sales, with the Trump family receiving approximately 75% of all revenue from the platform.
The numbers are staggering: World Liberty Financial has raised over $520 million from investors, with Trump and his family pocketing an estimated $390 million after taxes. This includes investments from controversial figures like Chinese billionaire Justin Sun, who invested $75 million just as SEC investigations against him were mysteriously dropped after Trump took office.
Even more lucrative has been Trump's $TRUMP memecoin, launched just days before his inauguration. This venture has generated an estimated $315 million in trading fees for Trump and his associates, while ordinary investors have lost billions. According to blockchain analysis, approximately 764,000 wallets lost money trading the coin, while 58 wallets made over $10 million each—likely including those controlled by Trump's inner circle.
Traditional Business Beneficiaries
While cryptocurrency dominates headlines, Trump's traditional businesses have also prospered enormously from his presidency. Mar-a-Lago, his Florida resort that serves as the unofficial "Winter White House," generated over $56 million in revenue during 2024. This represents a significant increase from previous years.
Trump's golf empire has been similarly lucrative, with his courses collectively generating $378 million in revenue during 2024. Trump National Doral alone produced $110 million, making it one of his most profitable single assets.
Summary Tables of Key Financial Figures
| Metric | Value |
|---|---|
| Trump Income 2024 | $600 million |
| Trump Net Worth Mid-2025 Range | $5.1 - $7.08 billion |
| Cryptocurrency % of Net Worth | 60% |
| Cryptocurrency Value | $3.3 billion |
| Metric | Value |
|---|---|
| Token Sales Revenue | $57.7 million |
| Family Revenue Share | 75% |
| Total Raised From Investors | $520 million |
| Family Pocketed | $390 million |
| Justin Sun Investment | $75 million |
| TRUMP Memecoin Trading Fees | $315 million |
| Wallets That Lost Money | 764,000 |
| Wallets with >$10M Earnings | 58 |
| Business | Revenue |
|---|---|
| Mar-a-Lago | $56 million |
| Trump Golf Empire | $378 million |
| Trump National Doral | $110 million |
Part 2: The Economic Destruction - How Tariffs Devastated American Prosperity
The Tariff Explosion: Reaching Historic Heights
During Trump's second term, the average effective US tariff rate soared to approximately 18.3% by August 2025, the highest level in over a century. Tariffs sharply increased on goods from major trading partners, with rates including:
- India: 50%
- Brazil: 50%
- Canada: 35%
- European Union: 20%
- Japan: 24%
- United Kingdom: 10%
These tariffs covered a broad array of goods, from steel and aluminum (up to 50%) to automobiles (25%) and others, creating a sweeping protectionist trade environment unprecedented since the early 1900s.
The Inflation Catastrophe: Prices Surge Across America
Following the tariff hikes, inflation rebounded notably. The US annual inflation rate rose to 2.7% in June 2025, up from 2.4% in May. The surge was particularly evident in goods highly dependent on imports:
- Apparel prices surged by 17%
- Food costs increased by 2.8%
- Motor vehicle prices rose by 8.4%
Month-over-month increases include coffee (+2.2%), toys (+1.8%), and appliances (+1.9%), reflecting the pass-through of higher import taxes to consumers. These tariffs effectively acted as a regressive tax, costing American households an estimated $3,800 annually, with lower-income families disproportionately burdened by about $1,700 of that amount.
GDP Collapse: The Economy Contracts Under Trade War Pressure
Economic growth suffered due to tariff-related costs and retaliatory measures. According to economic analyses, tariffs reduced US GDP growth by approximately 0.9 percentage points in 2025, leaving the economy permanently smaller by about 0.6%, which translates into roughly $160 billion lost in annual output.
US exports fell sharply, with export volumes declining by about 18.1%, devastating key sectors like agriculture and manufacturing, and intensifying concerns about a looming recession driven by reduced consumer spending and business uncertainty.

Summary Tables of Tariffs and Economic Effects
| Country/Region | Tariff Rate |
|---|---|
| India | 50% |
| Brazil | 50% |
| Canada | 35% |
| European Union | 20% |
| Japan | 24% |
| United Kingdom | 10% |
| Average US Effective Tariff Rate (Aug 2025) | 18.3% |
| Measure | Value |
|---|---|
| Annual Inflation Rate (June 2025) | 2.7% |
| Apparel Price Increase | 17% |
| Food Price Increase | 2.8% |
| Motor Vehicle Price Increase | 8.4% |
| Estimated Annual Cost to Household | $3,800 |
| US GDP Growth Reduction (2025) | -0.9 percentage points |
| Permanent GDP Contraction | -0.6% |
| Export Volume Decline | 18.1% |
Part 3: The Employment Crisis - Jobs Disappear as Trade Wars Intensify
Manufacturing Meltdown: The Sector Trump Promised to Save
Despite promises to revive American manufacturing, the sector has faced significant job losses amid the tariff wars. In July 2025 alone, U.S. manufacturing employment dropped by 11,000 jobs, continuing a slump observed over several months. The Institute for Supply Management's manufacturing employment index fell to 43.4 in July, the lowest since 2020, indicating contraction. Higher costs for imported raw materials and components have made U.S. manufacturing less competitive, leading to sustained job cuts.
The Jobs Report Disaster: Economic Weakness Exposed
The July 2025 U.S. jobs report revealed a sharp slowdown in labor market growth. Only 73,000 jobs were added—well below economists’ expectations of over 100,000. Moreover, revisions show that May and June combined added 258,000 fewer jobs than initially reported. Unemployment rose slightly to 4.2%, and labor force participation declined.
The bulk of new jobs came from healthcare and social assistance sectors, with 55,400 healthcare jobs added in July—accounting for 76% of all new employment. Outside these sectors, job growth was minimal or negative, signaling broader economic fragility likely tied to trade tensions and tariff impacts.
Small Business Devastation: The Hidden Victims
Small businesses, which make up around 97% of U.S. importers, have been hit hard by tariff-driven cost increases. Many face increased expenses of 10-20% due to tariffs on imported goods, supply chain disruptions, and rising administrative burdens. Without the financial buffers of large firms, small businesses have cut jobs substantially, with an estimated 3% employment drop (about 366,000 jobs) among firms with fewer than ten employees.
Rising operational costs and market uncertainty have forced many to either raise prices, risking customer loss, or absorb costs, risking insolvency. Recent surveys indicate nearly two-thirds of small business owners cite economic insecurity as their top challenge in 2025.

Summary Tables of Employment Data (July 2025)
| Metric | Value |
|---|---|
| Manufacturing Jobs Lost in July 2025 | 11,000 |
| ISM Manufacturing Employment Index (July 2025) | 43.4 (lowest since 2020) |
| Total Manufacturing Workers (July 2025) | ~13 million |
| Metric | Value |
|---|---|
| Total Jobs Added (July 2025) | 73,000 |
| Expected Job Growth (July 2025) | 100,000-115,000 |
| May-June Combined Job Revisions | -258,000 jobs |
| Unemployment Rate | 4.2% |
| Healthcare Job Gains (July 2025) | 55,400 |
| Healthcare Jobs as % of New Jobs | 76% |
| Metric | Value |
|---|---|
| Small Business Employment Decline | 3% (approx. 366,000 jobs) |
| Cost Increase for Small Businesses | 10-20% |
| % of Small Businesses Citing Economic Insecurity | ~66% |
Part 4: The Stock Market Catastrophe - Trillions Lost in Market Value
The April 2025 Crash: When Reality Hit Wall Street
On April 2, 2025, President Trump announced sweeping tariffs on numerous countries, a move he termed "Liberation Day." This triggered an immediate and severe crash in the global stock markets, marking one of the largest sell-offs in recent history. The S&P 500 lost approximately 10% of its value over the two days following the announcement. The Dow Jones Industrial Average fell over 4,000 points, a drop of about 9.5%, and the Nasdaq Composite plunged 11%, entering bear market territory.
This crash equated to over $6.6 trillion in market value lost within just two days, characterized by rapid consecutive days of steep declines not seen before. The Russell 2000 index also entered a bear market with a fall of 6.59% on April 3, compounding fears of widespread market instability.
The VIX volatility index, Wall Street's "fear gauge," spiked sharply to close at 45.31 points, the highest since the 2020 stock market crash during the COVID-19 pandemic. This reflected intense investor panic and uncertainty about the economic outlook amid escalating trade tensions.
The Recovery Mirage: Temporary Gains, Long-term Damage
Following the worst days of the crash, the administration announced a 90-day pause on many reciprocal tariffs on April 9, 2025. This led to a historic rebound with the S&P 500 posting one of its largest single-day gains ever, climbing by nearly 8%. Despite these temporary rallies, the S&P 500 and Dow Jones indices remained below their pre-tariff levels for much of the subsequent months, underscoring the persistent damage and volatility introduced by uncertain trade policies.
Market analysts noted that while large companies appeared to absorb some tariff-related costs during this period, the uncertainty surrounding tariffs increased long-term investment risks. The Chicago Board Options Exchange's sustained elevated VIX levels reflected ongoing nervousness among investors well beyond the initial crash.

Summary Table: Key Market Movements April 2-4, 2025
| Index | April 2 Close | April 4 Close | Point Change | % Change |
|---|---|---|---|---|
| Dow Jones Industrial Average | 40,545.93 | 37,965.60 | -4,580.33 | -11.3% |
| S&P 500 | 5,396.52 | 5,062.25 | -334.27 | -6.2% |
| Nasdaq Composite | 16,550.60 | 15,603.26 | -947.34 | -5.7% |
| VIX Volatility Index | 30.31 (approx.) | 45.31 | +15.00 | +49.5% |
Part 5: The Global Retaliation - America Isolated and Economically Damaged
Trading Partners Strike Back: Reciprocal Tariffs Multiply Damage
The aggressive tariff war initiated by President Trump has triggered a wave of retaliatory tariffs from major economic partners, compounding the damage to U.S. exports and global economic stature. Key retaliatory actions include:
- China imposed tariffs up to 125% on select U.S. goods, severely restricting market access.
- Canada levied 25% tariffs on American vehicles and other goods, disrupting traditional supply chains.
- European Union prepared comprehensive retaliation packages targeting U.S. agricultural and manufactured exports.
- India faced a doubling of U.S. tariffs to 50%, significantly affecting seafood, textiles, gems, jewelry, and auto parts sectors.
- Brazil experienced tariffs as high as 50%, with its leadership calling for coordinated responses among BRICS countries.
Economic analysts report that retaliatory tariffs have resulted in up to a 49% reduction in U.S. exports compared to a baseline with no tariffs, devastating key sectors like agriculture and manufacturing. These actions have forced American exporters to lose market share permanently and face lowered revenues.
The Diplomatic Cost: Alliances Strained, Partnerships Broken
Beyond economic consequences, the tariff war has severely strained U.S. diplomatic relationships with key allies and strategic partners. Notably:
- Countries such as Canada, Mexico, and European Union members have begun contingency planning for reduced trade with the United States.
- India, amidst the 50% tariffs, has accelerated efforts toward economic self-reliance and diversified partnerships, impacting longstanding bilateral trade ambitions.
- BRICS nations have condemned the U.S. tariffs as unilateral coercive measures violating international trade norms, intensifying tensions.
- BRICS, including China, Russia, India, Brazil, and South Africa, are pursuing alternatives to the U.S. dollar-dominated global financial system, aiming to reduce American economic influence.
This diplomatic fallout threatens collaboration on critical global challenges like climate change, security, and innovation, fragmenting international cooperation.
Summary Tables of Major Retaliatory Tariffs and BRICS Responses
| Country/Bloc | Tariff Rate Applied | Key Affected Sectors |
|---|---|---|
| China | Up to 125% | Agriculture, Manufacturing, Technology |
| Canada | 25% | Vehicles, Machinery |
| European Union | Varied, typically 20-35% | Agricultural products, Manufactured goods |
| India | 50% | Seafood, Textiles, Gems, Jewelry, Auto Parts |
| Brazil | Up to 50% | Agriculture, Manufactured goods |
| Aspect | Details |
|---|---|
| Condemnation of U.S. Tariffs | Declared tariffs as unilateral coercive measures, inconsistent with WTO rules |
| Financial System Initiatives | Accelerated development of alternatives: "BRICS Pay," China's Cross-Border Interbank Payment System (CIPS) |
| Diplomatic Coordination | Increased high-level consultations among BRICS leaders to coordinate response |
| Trade Diversification | Efforts to strengthen intra-BRICS trade and reduce reliance on U.S. markets |
| Strategic Outlook | Push toward multipolar trade and economic alliances |

Evidence and Sources
- Trump's 50% Tariff on India: Economic Impact, Trade Tensions, and Strategic Response
- Trump imposes extra 25% tariff on Indian goods, ties hit new low - Reuters
- Trade Partners' Responses to US Tariffs - IMF Working Paper
- US Tariff on India: Catalyst for Economic Self-Reliance and Multipolar Trade - Vision IAS
- India - U.S. Joint Statement (February 13, 2025) - Ministry of External Affairs India
- Trump India Tariffs 2025 Live Updates - NDTV
- Will Trump's Tariff War Draw A United BRICS Response? - News18
- India U S Trade Relations: 2025 Outlook - Maheshwari & Co
- Brazil and India Strengthen Ties After Trump's Tariffs Upend Global Trade - New York Times
- BRICS Unites After India-US Showdown Over Trump's Tariffs - YouTube (N18G)